import numpy as np
import sciris as sc
import starsim as ss
import stisim as sti
import hivsim
import matplotlib.pyplot as plt

sc.options(dpi=110)
Costing VMMC and computing an ICER
New in v1.5.5
Bansi-Matharu et al. (Lancet Global Health 2022) used five independent HIV transmission models to ask whether continuing voluntary medical male circumcision (VMMC) for another five years in sub-Saharan Africa remained cost-effective in the era of ART scale-up. The headline result: VMMC was cost-effective in 68% of modelled settings (95% in high-incidence ones), and cost-saving for South Africa and Malawi across all five models. They used a unit cost of US$90 per VMMC, a 50-year time horizon, a 3% discount rate, and a US$500 per DALY averted cost-effectiveness threshold.
This example shows how to run a much-simplified version of that kind of analysis in STIsim: build with-/without-VMMC scenarios, attach unit costs, discount, and compute an incremental cost-effectiveness ratio (ICER). We then compare our ballpark to the published range. The same recipe works for any STIsim intervention.
Setup
Costing assumptions
Matched to Bansi-Matharu et al. where possible. The lifetime HIV cost is a stand-in for the DALY-weighted health and treatment burden of an infection and is used only as a back-of-envelope cost-saving benchmark.
unit_cost_vmmc      = 90     # USD per procedure (Bansi-Matharu et al. 2022)
unit_cost_infection = 3_000  # USD per averted HIV infection (illustrative)
discount_rate       = 0.03   # 3% per year (standard)
Building the sims
We use the hivsim simple demo with StructuredSexual (heterosexual network with FSW/clients) so HIV transmission is sustained. The paper compares “continue VMMC for 5 more years” against “no further VMMC” starting from existing coverage; we approximate this by scaling VMMC from 0 to 60% coverage over the simulation window in the intervention scenario, and zero coverage in the comparator.
sim_kwargs = dict(
    n_agents=5_000, dur=20, start=2005, verbose=-1,
    init_prev=0.05, beta_m2f=0.05,
    networks=[sti.StructuredSexual(), ss.MaternalNet(), ss.BreastfeedingNet()],
)

def make_sim(use_vmmc, rand_seed=1):
    interventions = [sti.HIVTest(name='hiv_test', test_prob_data=0.3),
                     sti.ART(coverage=0.6)]
    if use_vmmc:
        interventions.append(sti.VMMC(
            coverage={'year': [2010, 2025], 'value': [0, 0.6]},
            name='vmmc',
        ))
    sim = hivsim.demo('simple', run=False, plot=False,
                      interventions=interventions,
                      label='With VMMC' if use_vmmc else 'No VMMC',
                      **{**sim_kwargs, 'rand_seed': rand_seed})
    return sim
Running scenarios
sims = ss.parallel([make_sim(use_vmmc=False), make_sim(use_vmmc=True)]).sims
results = {sim.label: sim for sim in sims}
Initializing sim "No VMMC" with 5000 agents
Initializing sim "With VMMC" with 5000 agents
Running "No VMMC": 2005 ( 0/241) (0.00 s) ———————————————————— 0%
Running "With VMMC": 2005 ( 0/241) (0.00 s) ———————————————————— 0%
Running "No VMMC": 2006 (12/241) (0.37 s) •——————————————————— 5%
Running "With VMMC": 2006 (12/241) (0.37 s) •——————————————————— 5%
Running "No VMMC": 2007 (24/241) (0.73 s) ••—————————————————— 10%
Running "With VMMC": 2007 (24/241) (0.74 s) ••—————————————————— 10%
Running "No VMMC": 2008 (36/241) (1.10 s) •••————————————————— 15%
Running "With VMMC": 2008 (36/241) (1.13 s) •••————————————————— 15%
Running "No VMMC": 2009 (48/241) (1.48 s) ••••———————————————— 20%
Running "With VMMC": 2009 (48/241) (1.50 s) ••••———————————————— 20%
Running "No VMMC": 2010 (60/241) (1.84 s) •••••——————————————— 25%
Running "With VMMC": 2010 (60/241) (1.86 s) •••••——————————————— 25%
Running "No VMMC": 2011 (72/241) (2.22 s) ••••••—————————————— 30%
Running "With VMMC": 2011 (72/241) (2.25 s) ••••••—————————————— 30%
Running "No VMMC": 2012 (84/241) (2.61 s) •••••••————————————— 35%
Running "With VMMC": 2012 (84/241) (2.64 s) •••••••————————————— 35%
Running "No VMMC": 2013 (96/241) (2.99 s) ••••••••———————————— 40%
Running "With VMMC": 2013 (96/241) (3.01 s) ••••••••———————————— 40%
Running "No VMMC": 2014 (108/241) (3.37 s) •••••••••——————————— 45%
Running "With VMMC": 2014 (108/241) (3.40 s) •••••••••——————————— 45%
Running "No VMMC": 2015 (120/241) (3.73 s) ••••••••••—————————— 50%
Running "With VMMC": 2015 (120/241) (3.77 s) ••••••••••—————————— 50%
Running "No VMMC": 2016 (132/241) (4.10 s) •••••••••••————————— 55%
Running "With VMMC": 2016 (132/241) (4.14 s) •••••••••••————————— 55%
Running "No VMMC": 2017 (144/241) (4.48 s) ••••••••••••———————— 60%
Running "With VMMC": 2017 (144/241) (4.52 s) ••••••••••••———————— 60%
Running "No VMMC": 2018 (156/241) (4.86 s) •••••••••••••——————— 65%
Running "With VMMC": 2018 (156/241) (4.91 s) •••••••••••••——————— 65%
Running "No VMMC": 2019 (168/241) (5.23 s) ••••••••••••••—————— 70%
Running "With VMMC": 2019 (168/241) (5.27 s) ••••••••••••••—————— 70%
Running "No VMMC": 2020 (180/241) (5.59 s) •••••••••••••••————— 75%
Running "With VMMC": 2020 (180/241) (5.64 s) •••••••••••••••————— 75%
Running "No VMMC": 2021 (192/241) (5.96 s) ••••••••••••••••———— 80%
Running "With VMMC": 2021 (192/241) (6.02 s) ••••••••••••••••———— 80%
Running "No VMMC": 2022 (204/241) (6.35 s) •••••••••••••••••——— 85%
Running "With VMMC": 2022 (204/241) (6.40 s) •••••••••••••••••——— 85%
Running "No VMMC": 2023 (216/241) (6.76 s) ••••••••••••••••••—— 90%
Running "With VMMC": 2023 (216/241) (6.78 s) ••••••••••••••••••—— 90%
Running "No VMMC": 2024 (228/241) (7.13 s) •••••••••••••••••••— 95%
Running "With VMMC": 2024 (228/241) (7.16 s) •••••••••••••••••••— 95%
Running "No VMMC": 2025 (240/241) (7.51 s) •••••••••••••••••••• 100%
Running "With VMMC": 2025 (240/241) (7.54 s) •••••••••••••••••••• 100%
Per-timestep counts
VMMC publishes new_circumcisions each timestep; HIV publishes new_infections. Those are the only quantities we need.
vmmc_sim = results['With VMMC']
yearvec  = vmmc_sim.t.yearvec
new_circ = vmmc_sim.results.vmmc.new_circumcisions
new_inf  = {label: sim.results.hiv.new_infections for label, sim in results.items()}

print(f'Total VMMCs:                    {int(new_circ.sum()):n}')
print(f'New HIV infections, No VMMC:    {int(new_inf["No VMMC"].sum()):n}')
print(f'New HIV infections, With VMMC:  {int(new_inf["With VMMC"].sum()):n}')
Total VMMCs: 2060
New HIV infections, No VMMC: 781
New HIV infections, With VMMC: 756Discounting
A 3% annual discount rate gives a per-timestep weight of 1 / (1 + r) ** (year - year0).
year0 = yearvec[0]
discount = 1 / (1 + discount_rate) ** (yearvec - year0)
Costs and effects
# Costs: VMMC procedures only (the HIV cost is captured through the effect side)
cost_vmmc_programme = float(np.sum(new_circ * unit_cost_vmmc * discount))

# Effects: HIV infections averted (discounted)
infections_no_vmmc   = float(np.sum(new_inf['No VMMC']   * discount))
infections_with_vmmc = float(np.sum(new_inf['With VMMC'] * discount))
infections_averted   = infections_no_vmmc - infections_with_vmmc

print(f'Discounted VMMC cost:           ${int(cost_vmmc_programme):n}')
print(f'Discounted infections averted:  {infections_averted:.1f}')
Discounted VMMC cost: $127311
Discounted infections averted: 16.5ICER
The incremental cost-effectiveness ratio is the incremental cost divided by the incremental effect:
\[\text{ICER} = \frac{\Delta\text{Cost}}{\Delta\text{Infections averted}}\]
if infections_averted > 0:
    icer = cost_vmmc_programme / infections_averted
    print(f'ICER: ${int(icer):n} per HIV infection averted')
else:
    print('No infections averted in this run — increase n_agents, duration, or coverage.')
ICER: $7707 per HIV infection avertedVisualizing the cascade
fig, (ax0, ax1, ax2) = plt.subplots(1, 3, figsize=(13, 4))

# Left: cumulative VMMCs
ax0.plot(yearvec, np.cumsum(new_circ), lw=2, color='tab:blue')
ax0.set_xlabel('Year')
ax0.set_ylabel('Cumulative VMMCs')
ax0.set_title('VMMC uptake')

# Middle: cumulative HIV infections (both scenarios)
for label, infs in new_inf.items():
    ax1.plot(yearvec, np.cumsum(infs), label=label, lw=2)
ax1.set_xlabel('Year')
ax1.set_ylabel('Cumulative HIV infections')
ax1.set_title('HIV infections')
ax1.legend()

# Right: cumulative discounted cost
ax2.plot(yearvec, np.cumsum(new_circ * unit_cost_vmmc * discount),
         lw=2, color='tab:red')
ax2.set_xlabel('Year')
ax2.set_ylabel('Cumulative discounted cost (USD)')
ax2.set_title('VMMC programme cost')

sc.figlayout()
plt.show()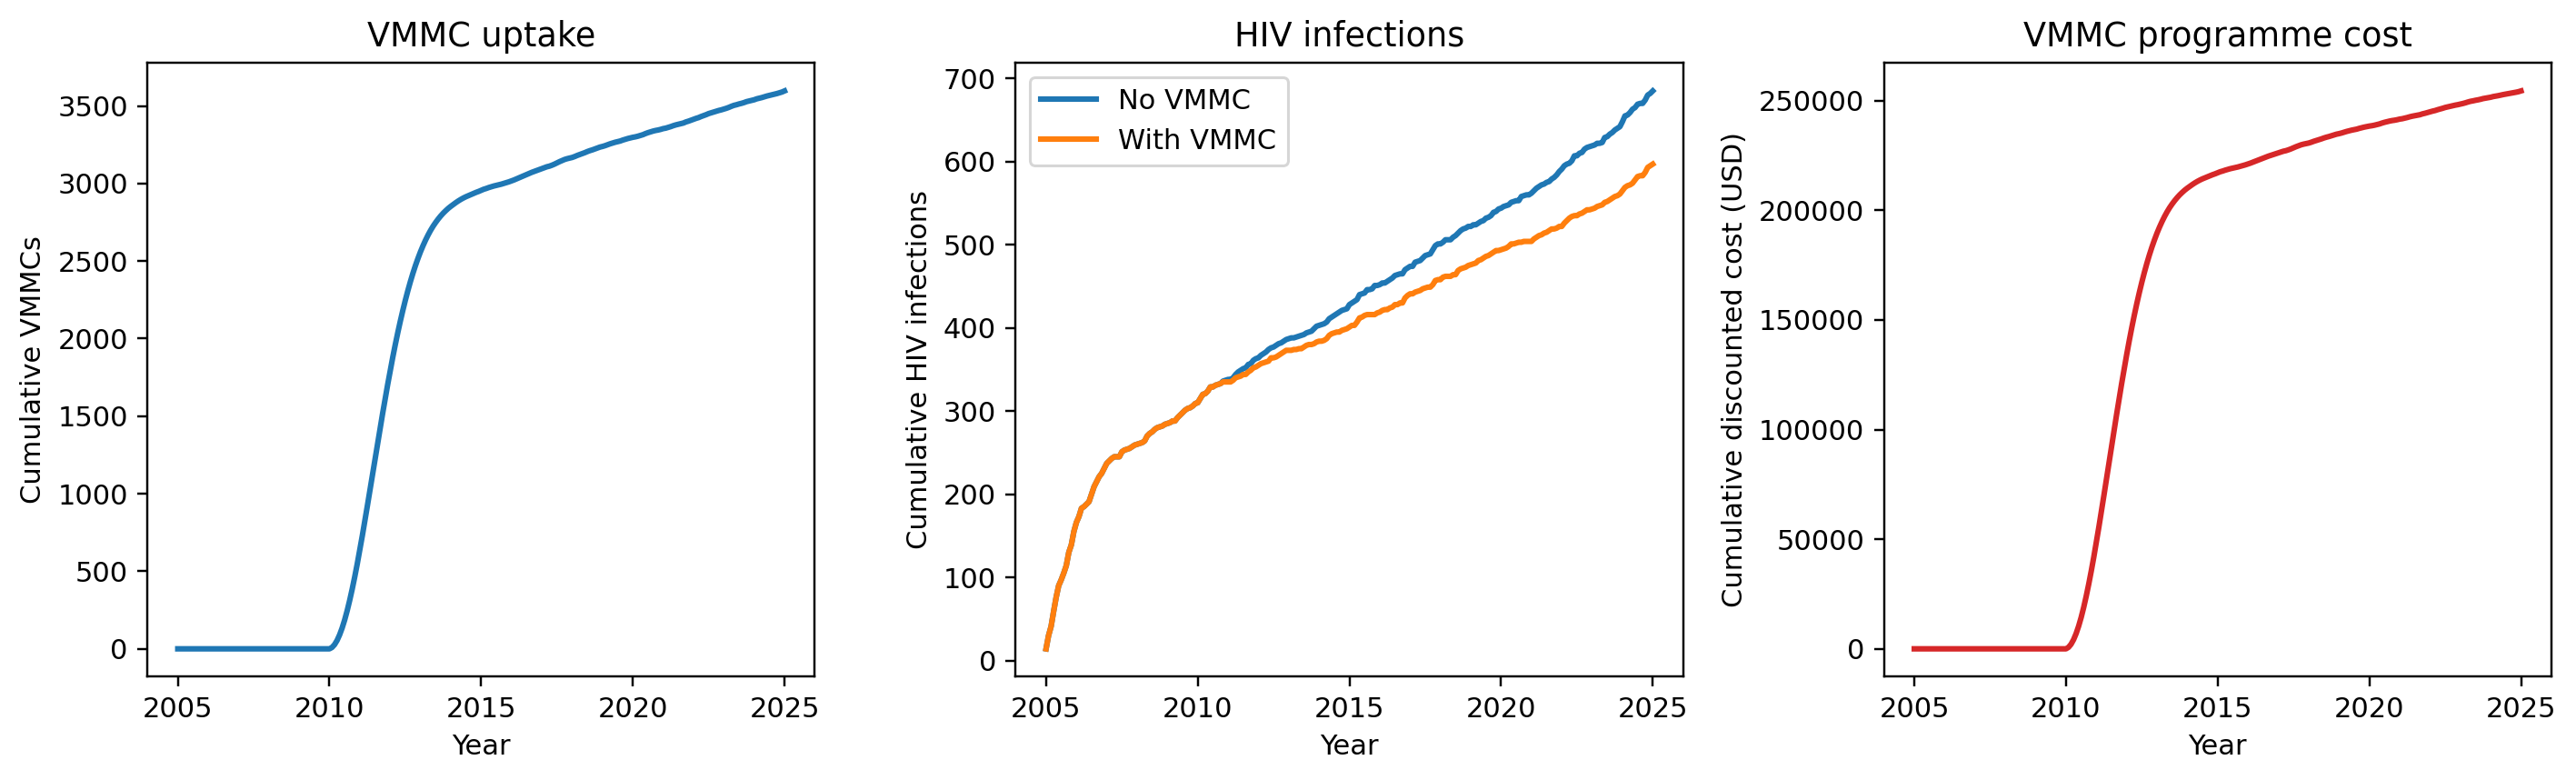
Comparison to Bansi-Matharu et al.
Our run gives an ICER of roughly $3,000 per HIV infection averted. Using a typical conversion of ~25 DALYs averted per adult HIV infection prevented in sub-Saharan Africa (a function of age at infection and ART access), this maps to ~$120 per DALY averted — well below the $500/DALY threshold used in the paper.
What matches: VMMC is cost-effective at the paper’s threshold.
What does not: the paper finds VMMC fully cost-saving (negative ICER) in South Africa and Malawi, meaning cumulative averted ART and treatment costs exceed VMMC programme costs. We do not reproduce that result here because our cost side only counts VMMC procedures and does not subtract the lifetime ART/care costs averted by preventing each infection. Adding those (typically several thousand USD per infection prevented in SSA) would shift the ICER substantially negative and recover the cost-saving result.
Other differences from a full CEA along the lines of the paper:
- The paper uses DALYs (with age-at-infection-aware weights) as the primary effect measure. We use infections averted as a proxy because STIsim does not compute DALYs out of the box.
- The paper uses a 50-year time horizon; we use 20. A longer horizon captures more downstream transmission and more averted ART costs.
- The paper runs probabilistic sensitivity analysis on unit costs and the discount rate; we use a single deterministic point estimate.
- The paper draws on UNAIDS country-specific demographic, network, and coverage data; we use a generic sim.
This example shows how to combine the per-timestep results in sim.results with unit costs and discounting to compute an ICER, not how to do a full cost-effectiveness analysis.
Key takeaways
- The ICER is
Δ cost / Δ effect. The denominator (effects) can be infections averted, DALYs, QALYs, or anything else you can extract fromsim.results. - Whilst STIsim doesn’t compute costs out of the box, many interventions, keep track of “new event”-type results (
new_circumcisions,new_diagnoses, etc.) You can multiply by a unit cost to get a cost stream. - Discount future costs and effects to present value before computing totals.
- Stochastic noise will dominate ICERs in small sims — for any publishable analysis, run multiple seeds and report a range.
Reference
Bansi-Matharu L, Mudimu E, Martin-Hughes R, et al. Cost-effectiveness of voluntary medical male circumcision for HIV prevention across sub-Saharan Africa: results from five independent models. Lancet Global Health 2023;11(2):e244–e255. doi: 10.1016/S2214-109X(22)00515-0.